Presentation slides are availble for most of the talks below (e.g. click “PRESENTATION SLIDE” link in each talk’s page). For some of the talks, we also had screen recording according to the speaker’s consent. Please check our video archieve.
may 2022
Event Details
Dear all, The Bioinformatics Club is back!! Wish you all doing well during the pandemic. Using the ERISXdl server with GPUs for Deep Learning Speaker: Ruifeng Hu, PhD Postdoc Fellow, Department of Neurology, Brigham and
Event Details
Dear all,
The Bioinformatics Club is back!! Wish you all doing well during the pandemic.
Using the ERISXdl server with GPUs for Deep Learning
Speaker: Ruifeng Hu, PhD
Postdoc Fellow, Department of Neurology, Brigham and Women’s Hospital, Harvard Medical School
Time: 12:00 PM, May 10th (Tuesday), 2022
Place: Hale Building 9004 conference room or zoom
Zoom link: https://harvard.zoom.us/my/bwhbioinformatics
The Bioinformatics Club is now part of the training efforts in the new Genomics and Bioinformatics Hub (https://bioinformatics.bwh.harvard.edu). In the hub, we provide bioinformatics collaboration, service, and training to the MGB/Harvard community. We love to keep the club running by aiming to nourish a learning environment of bioinformatics. So please join us, either as an attendee or a speaker. Please forward the links below for subscription to your colleague/friends who are interested in genomics and bioinformatics.
Thanks a lot,
Xianjun Dong, PhD

Time
(Tuesday) 12:00 pm - 1:00 pm
Location
BTM - 9004
60 Fenwood Road
Lecturer
Ruifeng Hu
october 2021
Event Details
We are excited to be launching a scRNAseq lecture course at Brigham and Women’s Hospital. This two-day course will be held on Monday, October
Event Details
We are excited to be launching a scRNAseq lecture course at Brigham and Women’s Hospital. This two-day course will be held on Monday, October 4th, and Tuesday, October 5th. We want to encourage you all to reserve these dates on your calendars now.
Today it is possible to obtain genome-wide transcriptome data from single cells using high-throughput sequencing (scRNA-seq). The main advantage of scRNA-seq is that the cellular resolution and the genome-wide scope make it possible to address issues that are intractable using other methods, e.g. bulk RNA-seq or single-cell RT-qPCR. However, to analyze scRNA-seq data, novel methods are required and some of the underlying assumptions for the methods developed for bulk RNA-seq experiments are no longer valid. In this course, we will discuss some of the questions that can be addressed using scRNA-seq as well as the available computational and statistical methods.
The intended audience is students, postdocs, and research staff who want to learn best practices for analyzing scRNAseq data. The course will involve hands-on practical exercises, and although no advanced programming skills are required, familiarity with the Unix command line and the scripting language R is required. Participants should bring their own laptops.
The course is organized by experienced computational biologists: Dr. Martin Hemberg, Dr. Xianjun Dong, and Dr. Ilya Korsunsky from BWH. We are also pleased to have Dr. Tallulah Andrews join us from the University of Toronto.
Please note the cost of attendance is $50.00 which must be charged to an MGB-associated fund number. (Although the event is marked ‘free’ on the website, this is because Eventbrite only supports credit cards and Paypal, which we are not able to process.) Please contact Allison Mello (amello4@bwh.harvard.edu) to set up payment.
Please click here to visit our course website for more information.
This is a 2-day lecture and will be held as an in-person event.
Monday, October 4th: 9 am— 4 pm @ BWH, Carrie Hall Conference Room, 15 Francis Street Boston, MA 02115
Tuesday, October 5th: 9 am— 5 pm @ BWH, Zinner Board Room, 70 Francis Street Boston, MA 02115
Sponsored by Brigham Research Institute (BRI) and the Genomics and Bioinformatics Hub
Time
october 4 (Monday) - 5 (Tuesday)
september 2020
Event Details
Speaker: Xiaoqi Li, Research Assistant in the Genomics and Bioinformatics Bub
Event Details
Speaker: Xiaoqi Li, Research Assistant in the Genomics and Bioinformatics Bub
Time
(Monday) 12:00 pm - 1:00 pm
Location
Zoom register link
Lecturer
Event Details
Bcbio is a community developed and validated framework for somatic and germline variant calling and gene expression analysis based on NGS data (WES, gene panels, UMI, WGS, WGBS, RNA-seq,
Event Details
Time
(Friday) 12:00 pm - 12:45 pm
Location
Zoom register link
Lecturer
august 2020
Event Details
A key aspect of my role as the director is to understand the research goals of our users and to identify ways in which the hub can best accelerate your
Event Details
A key aspect of my role as the director is to understand the research goals of our users and to identify ways in which the hub can best accelerate your research. For this purpose, I will host a zoom session at 11:00 AM on August 11th, along with Charles Jennings (who oversees the NeuroTechnology Studio), to introduce our team, answer your questions, and hopefully get your feedback.
To help us track attendees and interest, please register advance for the meeting:
https://harvard.zoom.us/meeting/register/tJMscuygrzguGtBBQkVg8MqnjQy92LKiUJsK
After registering, you will receive a confirmation email containing information about joining the meeting.
We look forward to seeing you on August 11 at 11:00 AM!
Update: The meeting was very successful. We have 79 participants. Thanks for all comments and feedback. We are looking forwards to working with you. The slide for the meeting is attached below.
Time
(Tuesday) 11:00 am - 12:00 pm
Location
Zoom
Lecturer
november 2019
Event Details
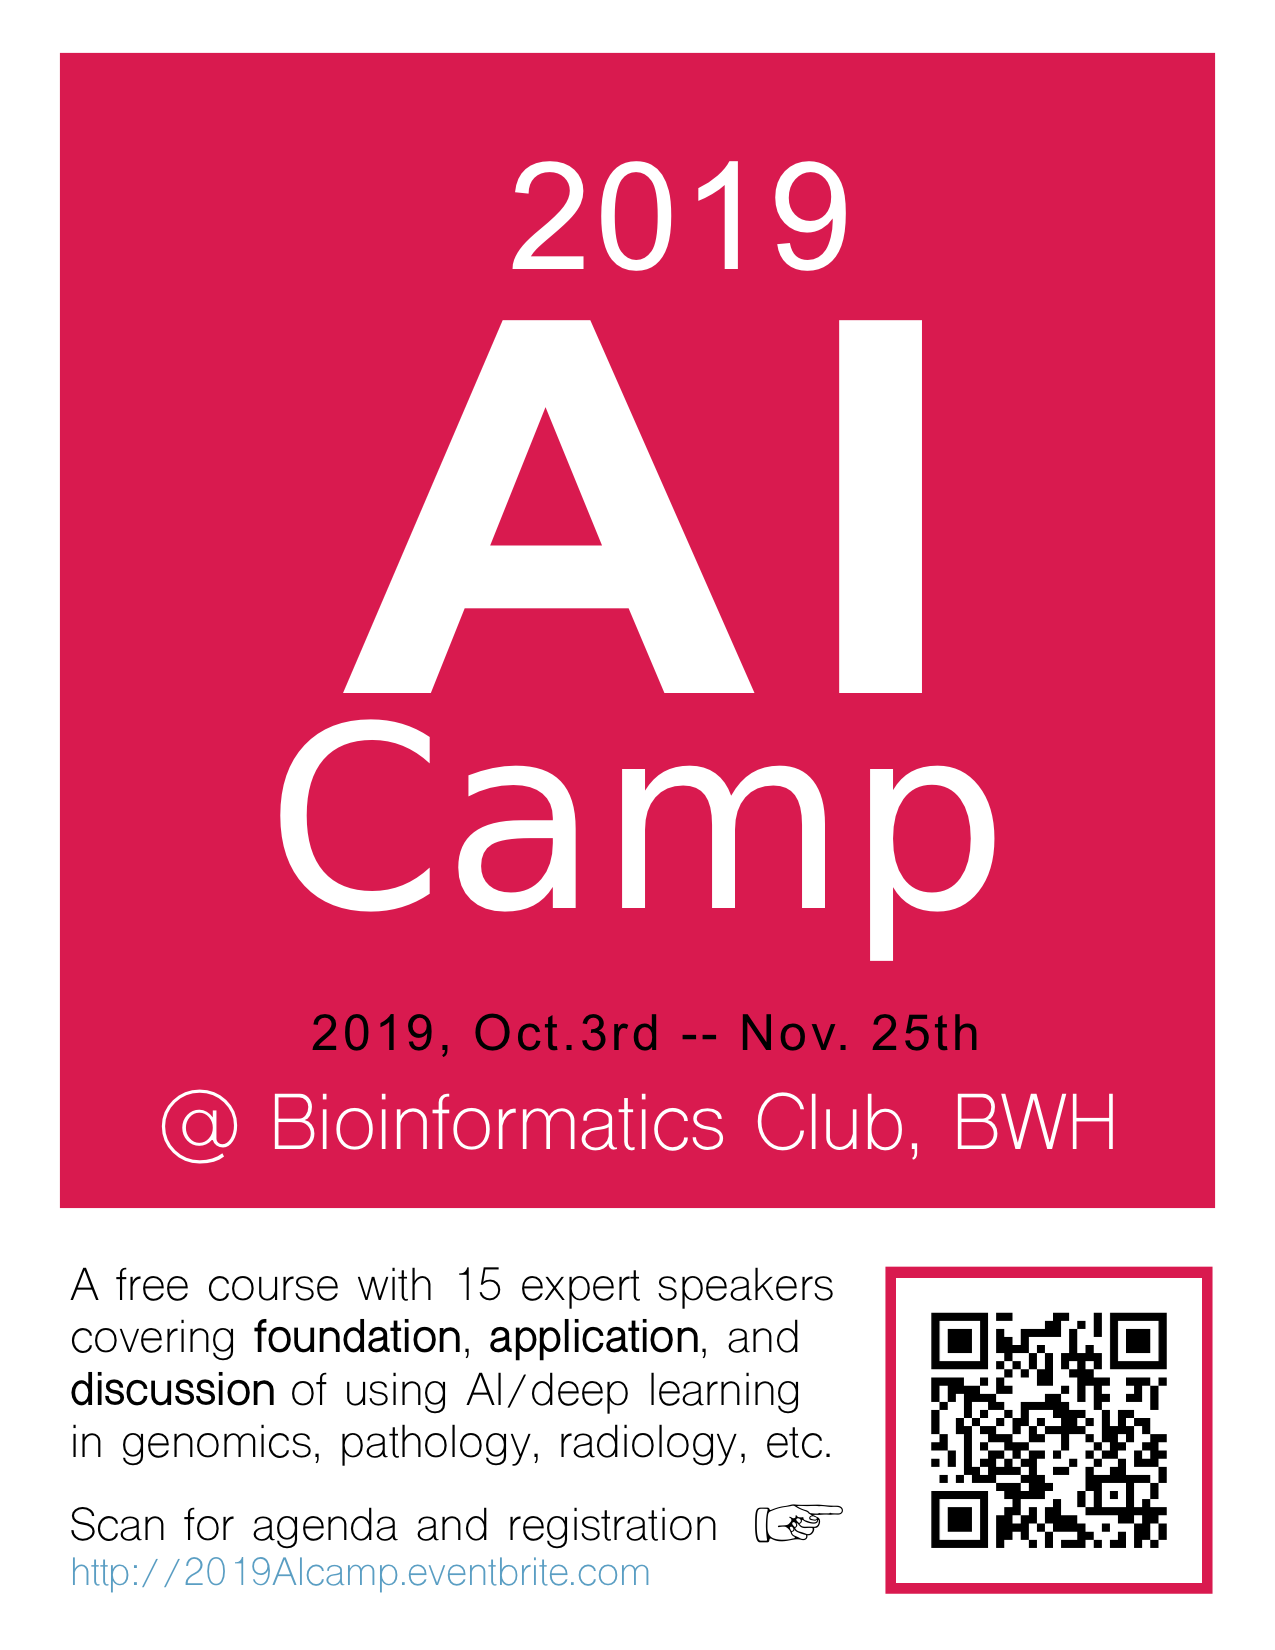
The AI camp will last from Oct 3rd to Nov. 25th, including 15+ talks. See the full agenda below. The camp will focus on machine learning and artificial intelligence, and its
Event Details
The AI camp will last from Oct 3rd to Nov. 25th, including 15+ talks. See the full agenda below. The camp will focus on machine learning and artificial intelligence, and its application in genomics, pathology, radiology, and clincal data, with hands-on practice, demo, and features talks from 15 experts. The course is organized into three sections: Foundation part will cover mathematics behind the neural network models, tools and resources for deep learning, and a two-hour python hand-on course; Application part will include practical examples and various applications in genomics, pathology, radiology, clinical, real-world data. In the end, we will have an Open Discussion about the challenge and unsolved questions in AI, with a panel of doctors, biologists, and computational scientists. So, it will be an exciting event and lots to expect!
See the agenda and speakers’ profiles here: http://bit.ly/2019aicamp
Registration is free, but required. Seats are limited. First come, first served. So please sign up now and prsent on time: http://2019AIcamp.eventbrite.com
Free lunch will be provided for registered attendees.
Materials/handout can be downloaded from the Presentation link below.
Recorded video for the talks can be found in the “Past talks” link on the top right menu after 1-2 weeks.
Time
October 3 (Thursday) - November 25 (Monday)
Lecturer
october 2019
Event Details
The AI camp will last from Oct 3rd to Nov. 25th, including 15+ talks. See the full agenda below. The camp will focus on machine learning and artificial intelligence, and its
Event Details
The AI camp will last from Oct 3rd to Nov. 25th, including 15+ talks. See the full agenda below. The camp will focus on machine learning and artificial intelligence, and its application in genomics, pathology, radiology, and clincal data, with hands-on practice, demo, and features talks from 15 experts. The course is organized into three sections: Foundation part will cover mathematics behind the neural network models, tools and resources for deep learning, and a two-hour python hand-on course; Application part will include practical examples and various applications in genomics, pathology, radiology, clinical, real-world data. In the end, we will have an Open Discussion about the challenge and unsolved questions in AI, with a panel of doctors, biologists, and computational scientists. So, it will be an exciting event and lots to expect!
See the agenda and speakers’ profiles here: http://bit.ly/2019aicamp
Registration is free, but required. Seats are limited. First come, first served. So please sign up now and prsent on time: http://2019AIcamp.eventbrite.com
Free lunch will be provided for registered attendees.
Materials/handout can be downloaded from the Presentation link below.
Recorded video for the talks can be found in the “Past talks” link on the top right menu after 1-2 weeks.
Time
October 3 (Thursday) - November 25 (Monday)
Lecturer
september 2019
Event Details
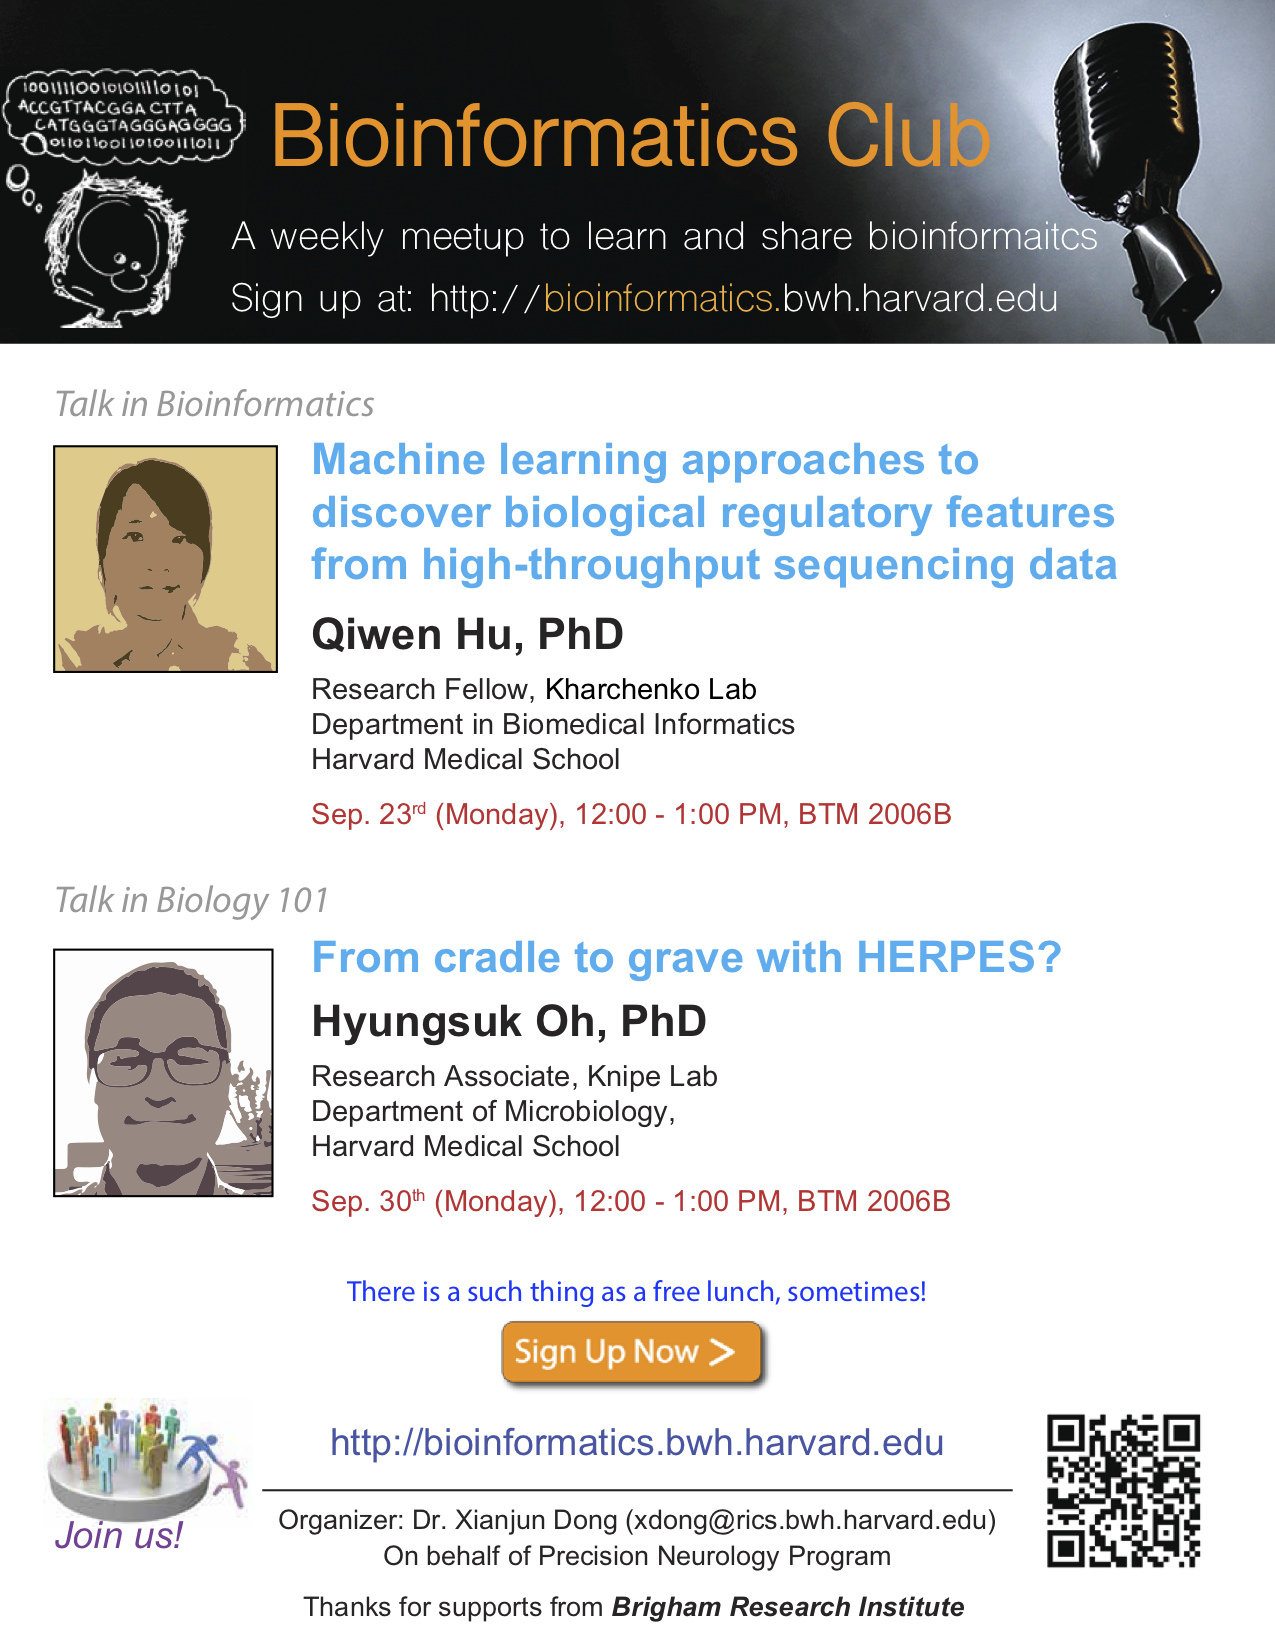
Dr. Oh from the department of Microbiology and Immunobiology, Harvard Medical School, will share us his insteresing story about herpes. Please come and join us.
Event Details
Dr. Oh from the department of Microbiology and Immunobiology, Harvard Medical School, will share us his insteresing story about herpes. Please come and join us.
Time
(Monday) 12:00 pm - 1:00 pm
Location
BTM 2006B
60 Fenwood Road, Boston, MA 02115
Lecturer
Event Details
Machine learning involves the creation and evaluation of algorithms related to classification, prediction and pattern recognition based on modeling a set of observed data. Machine learning has been successfully applied
Event Details
Machine learning involves the creation and evaluation of algorithms related to classification, prediction and pattern recognition based on modeling a set of observed data. Machine learning has been successfully applied in many areas such as image recognition and natural language processing. The rapid expansion of publicly available biological datasets provides great opportunities for discovery-driven research with poorly understood mechanisms and diseases. In this talk, I will introduce how machine learning models canbe used to extract biological meaningful regulatory signals from high-throughput sequencing data. We developed machine learning models based on different strategies in order to identify regulatory elements that contribute to transcription and translation in different model systems as well as disease-related signals from large publicly available datasets. Using supervised, semi-supervised and unsupervised approaches, we found that specific epigenetic factors such as histone marks are associated with and predict gene splicing patterns in the nucleus accumbens – a brain reward region related to drug addiction and developmental tissues in mammalian, with particular histone marks showing the significant enrichment at alternative spliced exons. We also identified the translated upstream open reading frames – a small sequence elements located upstream of a functional gene that may block the translation of main coding regions of the entire gene and the limitation of current models to analyze high dimensional sequencing datasets. Our results will provide the basis for predictive models of transcription and translation and contribute to a better understanding of regulatory mechanism in different model organisms.
Time
(Monday) 12:00 pm - 1:00 pm
Location
BTM 2006B
60 Fenwood Road, Boston, MA 02115
Lecturer
august 2019
Event Details
Mammalian chromatin is tightly compacted inside the 3D space of the nucleus in a highly ordered manner. Deformation of the 3D chromatin structure plays a profound role
Event Details
Time
(Monday) 12:00 pm - 1:00 pm
Location
BTM 2006B
60 Fenwood Road, Boston, MA 02115
Lecturer
Yan Kaiykai@jimmy.harvard.edu
Event Details
https://www.nature.com/articles/nmeth.3550
Event Details
https://www.nature.com/articles/nmeth.3550
Time
(Monday) 12:00 pm - 1:00 pm
Location
BTM 2006B
60 Fenwood Road, Boston, MA 02115
Lecturer
Time
(Monday) 12:00 pm - 1:00 pm
Location
BTM 2006B
60 Fenwood Road, Boston, MA 02115
Lecturer
Gary Ho, MDgary_ho@dfci.harvard.edu
july 2019
Event Details
Logistic regression is a powerful tool that extends beyond statistical applications; it serves as a window to machine learning. During this week's camp, we will explore the basics of logistic
Event Details
Logistic regression is a powerful tool that extends beyond statistical applications; it serves as a window to machine learning. During this week’s camp, we will explore the basics of logistic regression in comparison to linear regression. We will go through some detailed examples that can help researchers to implement logistic regression in medical research. If time allows, we will even be able to walk through some code with these examples.
Time
(Monday) 12:00 pm - 1:00 pm
Location
BTM 2006B
60 Fenwood Road, Boston, MA 02115
Lecturer
Kela Robertskar259@gmail.com
Event Details
Our favorite speaker Dr. Walid Abdelmoula will talk about the basic Bayesian statistics in an interactive way. Feel free to join us.
Event Details
Our favorite speaker Dr. Walid Abdelmoula will talk about the basic Bayesian statistics in an interactive way. Feel free to join us.
Time
(Monday) 12:00 pm - 1:00 am
Location
BTM 2006B
60 Fenwood Road, Boston, MA 02115
Lecturer
june 2019
Event Details
Lorena will present clustering based on this Nature Method article: https://www.nature.com/articles/nmeth.4299
Event Details
Lorena will present clustering based on this Nature Method article:
https://www.nature.com/articles/nmeth.4299
Time
(Monday) 12:00 pm - 1:00 pm
Location
BTM 2006B
60 Fenwood Road, Boston, MA 02115
Lecturer
Lorena Pantanolpantano@iscb.org
Event Details
Almost everyone uses linear regression for their daily analysis. But do you know that there are several assumptions to check before you will apply linear regression model to your data? If
Event Details
Almost everyone uses linear regression for their daily analysis. But do you know that there are several assumptions to check before you will apply linear regression model to your data? If your data don’t satisfy the assumptions, what can you do? What’s R2 intuitively mean? etc.
The speaker Dr. Youngeun Hub is a Neurologist & Assistant Professor in South Korea. She is now a visting scholar in Dr. Clemens Scherzer’s lab at Brigham and Women’s Hospital, working on several interesting projects. She will review the following prime article in Nature Methods and cover the topic in various aspects. So it’s highly recommend to read the article before the talk.
Time
(Monday) 12:00 pm - 1:00 pm
Location
BTM 2006B
60 Fenwood Road, Boston, MA 02115
Lecturer
may 2019
Event Details
Dr. Wenbo Li is invited as a Featured Speaker of 2019 in the Bioinformatics Club. Dr. Li published several landmark papers in the field of enhancer RNAs (eRNAs) when he
Event Details
Dr. Wenbo Li is invited as a Featured Speaker of 2019 in the Bioinformatics Club. Dr. Li published several landmark papers in the field of enhancer RNAs (eRNAs) when he was a postdoc in Dr. Michael G. Rosenfeld’s group. Now he is an Assistant Professor in the McGovern Medical School of the University of Texas Health Science Center, and CPRIT Scholar in the Cancer Prevention Research Institute Of Texas.
Here is the abstract of his talk:
The “recognition” between an enhancer and its cognate promoter in eukaryotes ensures proper gene transcription output. However, both the biological basis and the pathological involvement of enhancer-promoter recognition remain poorly understood. Here, using estrogen-regulated enhancer-promoter communication as an initial model, we report that loss of a preferred promoter can unexpectedly release its regulatory enhancer to loop to and activate an alternative promoter(s) in its chromosomal neighborhood. This target switching process of active enhancers was referred to as “enhancer release and retargeting” (ERR). Based on additional analysis of disease risk loci, cancer mutation, and the GTEx database, putative ERR events represent a remarkably common, if overlooked, mechanism underlying alternative gene activation in cancer and neurodegeneration. Mechanistically, ERR may be controlled by a cohesin-mediated looping extrusion process but takes place in a much smaller genomic scale than topological domains or compartments. We expect that ERR plays a wide roles in determining gene-enhancer communication and gene expression deregulation in human disease.
Time
(Tuesday) 1:30 pm - 2:30 pm
Location
BTM - 3002
60 Fenwood Road, Boston, MA 02115
Event Details
EM algorithm is one of the core algorithms in statistics and machine learning. It has been widely used in many tools in the fields of bioinformatics, for example, motif discovery (MEME),
Event Details
EM algorithm is one of the core algorithms in statistics and machine learning. It has been widely used in many tools in the fields of bioinformatics, for example, motif discovery (MEME), comparative genomics (Phylo-HMM), multiple sequence alignment (ClustalW), NGS analysis (Cufflinks, RSEM, and eXpress), etc. So, please join us to master the hardcore technique.
Dr. Kazuki Yoshida will review the following Nature Biotechnology prime article:
https://www.nature.com/articles/nbt1406
Time
(Monday) 12:00 pm - 1:00 pm
Location
BTM 2006B
60 Fenwood Road, Boston, MA 02115
Lecturer
april 2019
Event Details
https://www.nature.com/articles/nmeth.4210
Event Details
Time
(Monday) 12:01 pm - 1:00 pm
Location
BTM 2006B
60 Fenwood Road, Boston, MA 02115
Lecturer
Event Details
http://www.nature.com/nbt/journal/v24/n12/abs/nbt1206-1565.html
Event Details
http://www.nature.com/nbt/journal/v24/n12/abs/nbt1206-1565.html
Time
(Monday) 12:00 pm - 1:00 pm
Location
BTM 2006B
60 Fenwood Road, Boston, MA 02115
Lecturer
Event Details
As the opening talk of the Mini Statistics Camp this year, Dr. Joseph J. Locascio from Harvard Medical School and affiliated BWH and MGH will give a talk entitled "The Algebra of Causality". Below
Event Details
I would like to discuss basic data analysis methods for causal modeling. Given my background originating in applied statistics for the behavioral sciences, where causal modeling of one form or another has been used for decades and given its more recent introduction to bio-medical statistics, I would like to introduce some basic aspects of it that may be unfamiliar to bio-medical researchers and even many biostatisticians. As a backdrop, I will refer to a recent book which has created quite a bit of interest on this subject, “The Book of Why” (2018) by Judea Pearl, who claims that a “Revolution in Causality” is taking place in data analysis and science. (Reading the book is not a prerequisite for my talk). I want to emphasize that the purpose of my presentation is not to explain how to conduct any specific data analysis technique like structural equation modeling (SEM), path analysis, or confirmatory factor analysis (using e.g., the SAS Calis Procedure), though I will touch on that. Rather I will try to show people how causal models, especially as explicated with causal diagrams, can be seen as underlying research questions tested by many varied statistical techniques and to hopefully provide a helpful way of making certain decisions about appropriate data analyses given the research questions and available data. Thus, I want to emphasize causal modeling as a methodology rather than a specific method.
Time
(Monday) 12:00 pm - 1:00 pm
Location
BTM 2006B
60 Fenwood Road, Boston, MA 02115
Lecturer
Event Details
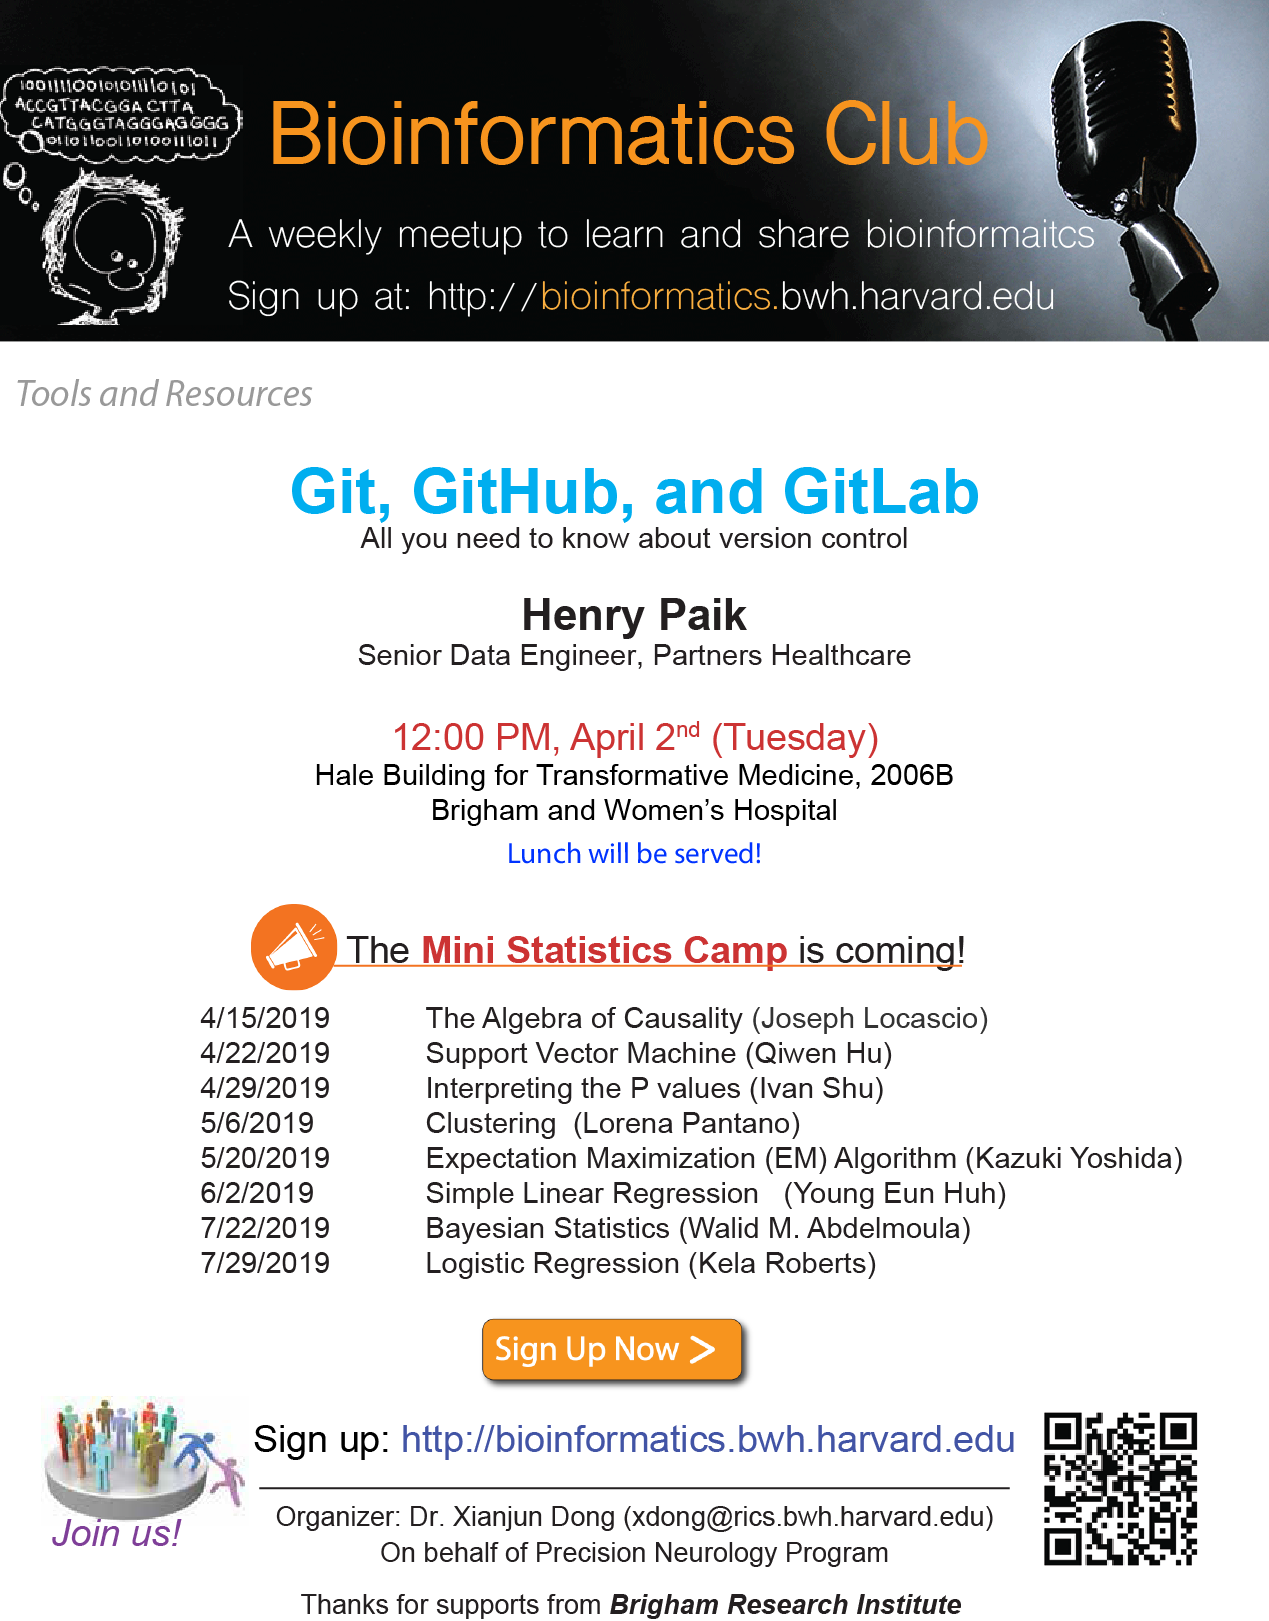
a 101 talk on how to use git / github / gitlab. More details to be announced.
Event Details
a 101 talk on how to use git / github / gitlab. More details to be announced.
Time
(Tuesday) 12:00 pm - 1:00 pm
Location
BTM 2006B
60 Fenwood Road, Boston, MA 02115
march 2019
Event Details
TBD
Event Details
TBD
Time
(Monday) 12:00 pm - 1:00 pm
Location
BTM 2006B
60 Fenwood Road, Boston, MA 02115
Lecturer
Event Details
Dr. Lorena from the Department of Statistics of Harvard T.H. Chan School of Public Health will talk about how to accurately detect miRNA isoforms ("isomiRs") based on different sequencing platforms.
Event Details
Dr. Lorena from the Department of Statistics of Harvard T.H. Chan School of Public Health will talk about how to accurately detect miRNA isoforms (“isomiRs”) based on different sequencing platforms. She will introduce the popular toolkit, mirTOP, for miRNA variant analysis. In the end, she will give a useful guideline for how to choose platforms/protocols/sequencing depth/replication number etc. in order to detect the true miRNA variants. Find more information from the slide attached.
Time
(Monday) 12:00 pm - 1:00 pm
Location
BTM 2006B
60 Fenwood Road, Boston, MA 02115
Lecturer
Lorena Pantanolpantano@iscb.org
december 2018
Event Details
Dr. Abdelmoula will focus on explaining the mathematics behind some famous dimensionality reduction techniques: PCA, t-SNE, and hSNE. He will also show examples and live demos from some applications in
Event Details
Time
(Monday) 1:00 pm - 2:00 pm EST
Location
BTM 2006B
60 Fenwood Road, Boston, MA 02115
Lecturer
november 2018
Event Details
Dr. Beatrice Weykopf from the Neurogenomics Lab of BWH will introduce the biology of iPSC and her research in Parkinson's disease.
Event Details
Dr. Beatrice Weykopf from the Neurogenomics Lab of BWH will introduce the biology of iPSC and her research in Parkinson’s disease.
Time
(Monday) 12:00 pm - 1:00 pm
Location
BTM 2006B
60 Fenwood Road, Boston, MA 02115
Event Details
Dr. Ilya Korsunskiy from the Raychaudhuri Lab @ HMS, BWH will talk about how to analyze scRNAseq data on your laptop. Very cool! Sign up for more details.
Event Details
Dr. Ilya Korsunskiy from the Raychaudhuri Lab @ HMS, BWH will talk about how to analyze scRNAseq data on your laptop. Very cool! Sign up for more details.
Time
(Monday) 1:00 pm - 2:00 pm
Location
BTM 2006B
60 Fenwood Road, Boston, MA 02115
Lecturer
Ilya Korsunskiy, PhDilya.korsunsky@gmail.com
october 2018
Event Details
Emily will introduce various pathway analysis methods, including IPA, GSEA, SPIA, Enrichr etc. with demo and examples. More details to be announced.
Event Details
Emily will introduce various pathway analysis methods, including IPA, GSEA, SPIA, Enrichr etc. with demo and examples. More details to be announced.
Time
(Tuesday) 12:00 pm - 1:00 pm EST
Location
BTM 2006B
60 Fenwood Road, Boston, MA 02115
Lecturer
Emily Tjonetjon@bwh.harvard.edu
Event Details
Sequencing methods have become commonplace. Many laboratories generate tens of samples in a day and hundreds of libraries worth of data every month. Sequence data, however, as opposed to previous
Event Details
Sequencing methods have become commonplace. Many laboratories generate tens of samples in a day and hundreds of libraries worth of data every month. Sequence data, however, as opposed to previous technologies, significant computational power and knowledge required for a scientific discovery. The current bottleneck for many laboratories is the processing and analysis of data in a timely manner. As sequencing becomes both cost effective and inexpensive, experiments increase in complexity. A single sequencing run usually includes many different conditions and replicates designed to answer a specific question. To process all samples in a study as a unit, automated data processing pipelines are necessary by leveraging the power of parallel nature of current computer environments called high performance computing (HPC) systems for a faster outcome. To address data processing and analysis, we implemented a highly parallel, platform, called DolphinNext specifically designed to process sequencing data generated towards answering a specific question. Once the data is processed, the result is usually a count table that specifies the estimated number of reads that originate from genomic loci. Differential analysis to determine which loci have different cellular activity in different conditions is based on this count tables and it requires a common, iterative, cycle of data assessment, data preparation and differential analysis. We developed DEBrowser as an R bioconductor project, to interactively visualize every step of the differential analysis of count data without requiring any programming expertise. It is based on a shiny infrastructure, which offers an interactive, web based graphical user interface for R packages. We leveraged the reactive programming of shiny to visualize the data at all stages of the analysis.
Time
(Tuesday) 2:00 pm - 3:00 pm EST
Location
BTM 2006B
60 Fenwood Road, Boston, MA 02115
may 2018
Time
(Monday) 1:00 pm - 2:00 pm EST
Location
BTM 2006B
60 Fenwood Road, Boston, MA 02115
Lecturer
Event Details
This talk will feature three techniques (linear and non-linear), namely: 1- PCA, 2- Deep learning based approach (Autoencoder), and 3- t-distributed stochastic neighbor embedding (t-SNE). Dr. Abdelmoula will show some applications on the
Event Details
Time
(Tuesday) 12:00 pm - 1:00 pm
Location
BTM 2006B
60 Fenwood Road, Boston, MA 02115
Lecturer
march 2018
Event Details
High-throughput sequencing technologies have been widely used in modern genomics studies. Due to experimental/technical issues, diverse sources of biases can be introduced into the sequencing data and subsequently
Event Details
High-throughput sequencing technologies have been widely used in modern genomics studies. Due to experimental/technical issues, diverse sources of biases can be introduced into the sequencing data and subsequently disturb the downstream analysis. In the talk, I will use ChIP-seq as an example to demonstrate how we improved the downstream analysis by accounting for biases. I will discuss the effects of GC-content bias in large ChIP-seq datasets and our proposed statistical method to account for this bias in protein binding quantification.
Time
(Tuesday) 12:00 pm - 1:00 pm EST
Lecturer
Event Details
Note the changed time due to the snowstorm.
Event Details
Note the changed time due to the snowstorm.
Time
(Monday) 12:15 pm - 1:00 pm EST
Location
BTM 2006B
60 Fenwood Road, Boston, MA 02115
Lecturer
Event Details
Path Analysis (also referred to as Structural Equation Modeling, SEM, or causal modeling) is a method for systematically studying the possible causal models that may underlie an observed
Event Details
Path Analysis (also referred to as Structural Equation Modeling, SEM, or causal modeling) is a method for systematically studying the possible causal models that may underlie an observed correlation matrix of variables. In path analysis, various explicitly detailed models of causal dynamics are hypothesized. Then the fit of the observed correlation matrix to what would be the correlation matrix predicted by a given hypothetical causal model is assessed. This is done in order to obtain support and greater specification for the proposed model and rule out as statistically improbable alternative models. Path analysis can be viewed as a specific statistical analysis method or as a more general methodological approach to research, i.e., an “algebra of causality”. I will discuss both points of view, but will emphasize more the latter. Path analysis methodology allows for a more fundamental and flexible approach to understanding some statistical techniques currently considered useful and important such as mediation/moderation analysis, factor analysis, latent variable analysis, multiple regression, partial correlation, and analysis of covariance.
Time
(Tuesday) 1:00 pm - 2:00 pm
Location
BTM - 9004
60 Fenwood Road
Lecturer
february 2018
Time
(Tuesday) 1:15 pm - 2:15 pm
Location
BTM 2006B
60 Fenwood Road, Boston, MA 02115
Lecturer
Time
(Monday) 1:00 pm - 2:00 pm
Location
BTM 2006B
60 Fenwood Road, Boston, MA 02115
Lecturer
Time
(Tuesday) 12:00 pm - 1:00 pm
Location
BTM 2006B
60 Fenwood Road, Boston, MA 02115
january 2018
Time
(Tuesday) 12:00 pm - 1:00 pm
Location
BTM 2006B
60 Fenwood Road, Boston, MA 02115
Lecturer
Time
(Thursday) 12:00 pm - 1:00 pm
Location
BTM 10004
60 Fenwood Road
Lecturer
Time
(Friday) 11:00 am - 12:00 pm
Location
BTM 2006B
60 Fenwood Road, Boston, MA 02115
Lecturer
december 2017
Event Details
Our human body can make more than 120 billion difference antibody molecules, which form the basis of the immune response to environmental factors including microbiome and food antigens. How is this
Event Details
Time
(Monday) 12:00 pm - 1:00 pm
Location
BTM - 9004
60 Fenwood Road
Lecturer
Event Details
For decades, many statisticians have criticized the inappropriate use and overuse of null hypothesis significance testing (NHST) especially in medical and behavioral science research. This controversy has now
Event Details
For decades, many statisticians have criticized the inappropriate use and overuse of null hypothesis significance testing (NHST) especially in medical and behavioral science research. This controversy has now especially intensified partly as a reaction to a recent ban on publishing results of NHST in the psychology journal Basic & Applied Social Psychology (BASP). The American Statistical Association has also recently taken the unusual step of publishing a formal policy statement cautioning against misuse of NHST. The NHST controversy is also intimately connected to other widely recognized problems in science publishing such as publication bias and “the crisis of irreproducibility”. Dr. Locascio will try to lay out the basic issues in these controversies and suggested solutions to these problems including one of his own just published in BASP.
Time
(Monday) 12:00 pm - 12:45 pm
Location
BTM - 9004
60 Fenwood Road
Lecturer
Event Details
Most commercial small RNA library preparation kits currently select a few RNA classes, rather than profile the full-coverage without bias. Dr. Wei will discuss the chemistry behind it,
Event Details
Most commercial small RNA library preparation kits currently select a few RNA classes, rather than profile the full-coverage without bias. Dr. Wei will discuss the chemistry behind it, and options to reduce bias.
Time
(Monday) 12:00 pm - 1:00 pm
Location
BTM - 9004
60 Fenwood Road
Lecturer
november 2017
Event Details
The Partners Clinical Image Bank (CIB) portal enables researchers to access registries of expertly curated, phenotypically characterized medical images and associated clinical data extracted from the Partners electronic medical records.
Event Details
The Partners Clinical Image Bank (CIB) portal enables researchers to access registries of expertly curated, phenotypically characterized medical images and associated clinical data extracted from the Partners electronic medical records.
Access to the Clinical Image Bank is available to all with a Partners logon who have registered to use the Research Patient Data Registry (RPDR) and who accept the terms of the Data Use Agreement. The portal enables full exploration and download of de-identified clinical information extracted from the RPDR and quantitative MR imaging metrics. Users with IRB approval who wish to download the fully identifiable clinical data and native DICOM medical images may do so easily.
The first registry to be made available is a collection of pediatric brain MR images that includes a cohort of neonates with clinically confirmed hypoxic ischemic encephalopathy, a cohort of “normative” children imaged between the ages of 0-6 years of age with no known CNS pathology and a cohort of children imaged between the ages of 0-6 years of age that have a neuropsychiatric disorder of indeterminate severity. In addition to secure access to the DICOM image data, the portal allows interaction with and download of extracted quantitative metrics from the Apparent Diffusion Coefficient (ADC) maps calculated from the Diffusion Weighted Images for many of the cases. Each HIE case also has detailed perinatal clinical course information including maternal risk factors and clinical outcomes.
Dr. Gollub, one of the developers of the CIB will demonstrate the use of this new software tool and provide a guided tour of the available data. She would like to gather your input on features and data sets that could be added that would be of greatest value to you in your work.
Time
(Monday) 10:00 am - 11:00 am
Location
BTM - 3002
60 Fenwood Road, Boston, MA 02115
Lecturer
Event Details
The IDEA Analytics platform is designed to perform complex analytics and data transformations across large and diverse datasets in a secure and reliable way. The platform provides research
Event Details
The IDEA Analytics platform is designed to perform complex analytics and data transformations across large and diverse datasets in a secure and reliable way. The platform provides research teams access to a range of open-source tools, including Hadoop and Spark, hosted on a highly scalable infrastructure specifically designed for large analytics workloads. In addition to well-known Hadoop applications such as Pig, Hive, and HBase, specialized machine learning and natural language processing tools are also integrated into the solution. The platform will be presented together with a demo on how to use it with PySpark in Jupiter and SparklyR in RStudio.
Time
(Monday) 12:00 pm - 1:00 pm
Location
BTM - 9004
60 Fenwood Road
Lecturer
october 2017
Time
(Monday) 12:00 pm - 1:00 pm
Location
BTM - 9004
60 Fenwood Road
Lecturer
Time
(Monday) 12:00 pm - 1:00 pm
Location
BTM - 9004
60 Fenwood Road
Lecturer
Time
(Monday) 12:00 pm - 1:00 pm
Location
BTM - 9004
60 Fenwood Road
Lecturer
Time
(Monday) 12:00 pm - 1:00 pm
Location
BTM - 9004
60 Fenwood Road
Lecturer
september 2017
Time
(Monday) 12:00 pm - 1:00 pm
Location
BTM - 9004
60 Fenwood Road
Time
(Monday) 12:00 pm - 1:00 pm
Location
BTM - 9004
60 Fenwood Road
Lecturer
Time
(Tuesday) 12:00 pm - 1:00 pm
Location
BTM - 9004
60 Fenwood Road
Lecturer
august 2017
Time
(Monday) 12:00 pm - 1:00 pm
Location
BTM - 9004
60 Fenwood Road
Time
(Monday) 12:00 pm - 1:00 pm
Location
BTM - 9004
60 Fenwood Road
Lecturer
july 2017
Time
(Monday) 12:00 pm - 1:00 pm
Location
BTM - 9004
60 Fenwood Road
Lecturer
Time
(Monday) 12:00 pm - 1:00 pm
Location
BTM - 9004
60 Fenwood Road
Lecturer
Time
(Monday) 12:00 pm - 1:00 pm
Location
BTM - 9004
60 Fenwood Road
Lecturer
Time
(Monday) 12:00 pm - 1:00 pm
Location
BTM - 9004
60 Fenwood Road